A Quarterly Economic Report from Colorado Mesa University Read Now
Delta County Yearly Economic Data Report from the State of Colorado Workforce Read the 2024 Economy Overview for Delta County Here
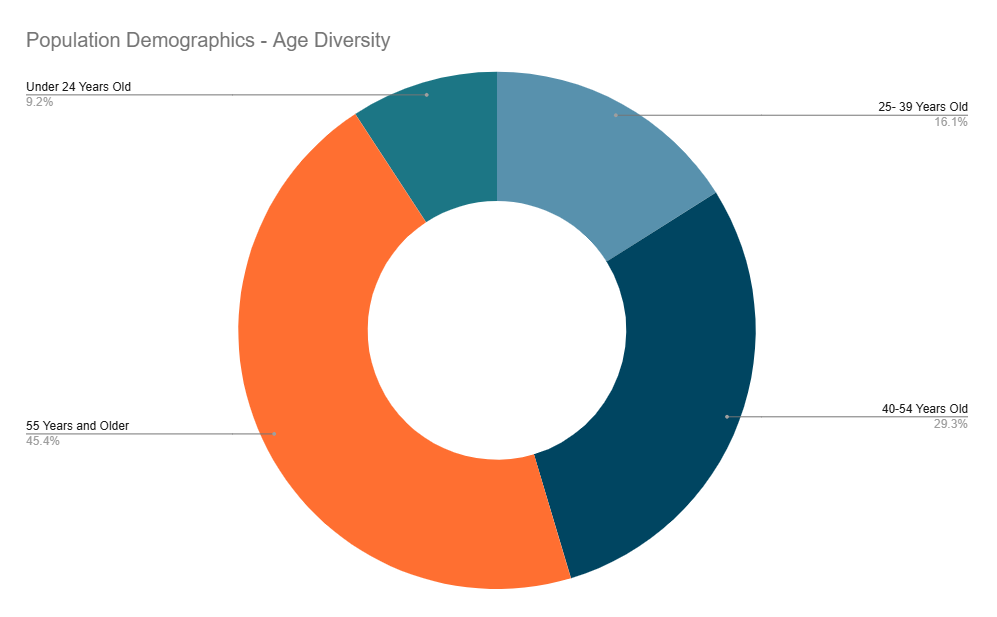
Population Demographics – Age Diversity
The population in Delta County, Colorado is 32,020 according to Lightcast Economy Overview by the Colorado Workforce 2024.
Delta County’s population has increased by 3.2% since 2019, growing by 999 and is projected to continue to increase by 3.1% adding 1,000 to the population by 2029. Nearly 46% ( 13,624)of the population is 55 years or older. This exceeds the national average ( 9,583) for an area this size. Delta County also has a higher than national average number of Veterans( 1,614) in an area this size, with 10% of the population ( 2727) being Veterans. Millennials ( ages 25-39 years) make up 17.9% of the population (4,822) falling under the national average for an area this size (6,450).
Source jobs Lightcast Economy Overview – Colorado Workforce

Labor Force
The Labor Force in Delta County, Colorado is at 14,442 ( 16+ years civilians) according to Lightcast Economy Overview by the Colorado Workforce 2024.
Labor Force Participation Rate is near 96%. The Labor Force size ( Civilian population 16 years and over) is 14,442, with 13,777 being employed.
Source jobs Lightcast Economy Overview – Colorado Workforce
Demographic Data Source: Lightcast Economic Overview – Colorado Workforce 2024
Job Trends
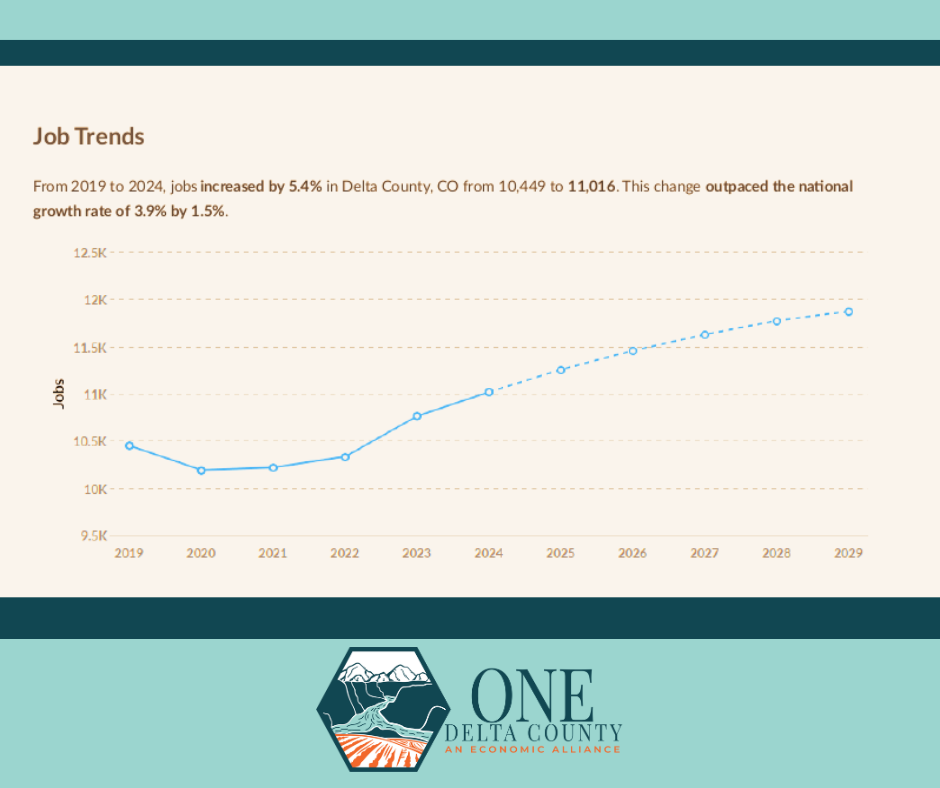
From 2019 to 2024, jobs increased by 5.4% in Delta County, Colorado from 10,449 to 11,016. This change outpaced the national growth rate of 3.9% by 1.5%.

Unemployment Trends
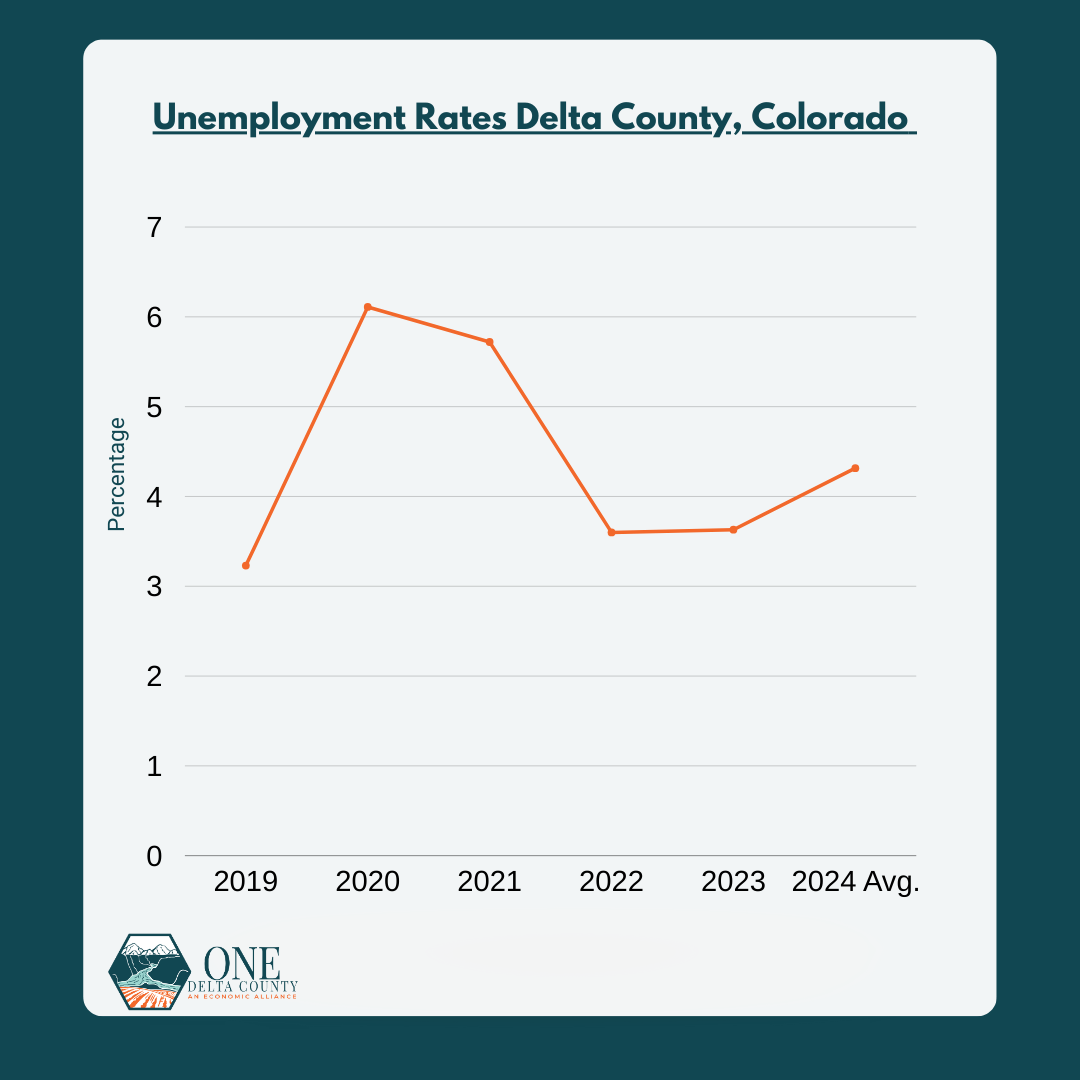
Delta County, Colorado – October 2024 had an unemployment rate of 4.47%, increasing from 3.23% five years prior.
- 2019 – 3.23%
- 2020 – 6.11%
- 2021 – 5.72%
- 2022 – 3.64 %
- 2023 – 3.36%
- January-October 2024- 4.32% Average

Demographic Data Source: Lightcast Economy Overview 2024- Colorado Workforce
Industry Snapshot of the Top 3 Industries
The largest three industries in Delta County, Colorado are Government, Retail Trade and Health Care & Social Assistance. Industries with the top growth are Manufacturing, Administrative,Support, Waste Management and Remediation Services and Construction. Delta County, Colorado’s top three largest employers are Delta County School District, Delta Health and West Elk Mine/ Arch Coal.
Source: Lightcast Economy Overview 2024- Colorado Workforce and One Delta County: An Economic Alliance Annual Report 2024.
<
Highest Average Wages Comparison by One Delta CountyEducational Attainment
17.3% of Delta County, Colorado residents possess a Bachelor’s Degree. This is 4.2% below the national average, and 6.3% of residents hold an Associates Degree ( 2.6% below the national average).
31746
Population has increased by 3.2% in Delta County, Colorado since 2019 and is expected to keep growing at a rate of 3.1%.Adding 1,000 to the population by 2029.
13,756
Over the last year, regional employment has increased by 4.24 % (560).
58,330
The average worker in Delta County, Colorado earned average weekly wages of $873, (annually $45,396), this was an increase of 5.35% from 2023Q4.
Cost of Living, Housing and Business Data
Business Data (GDP & GRP)
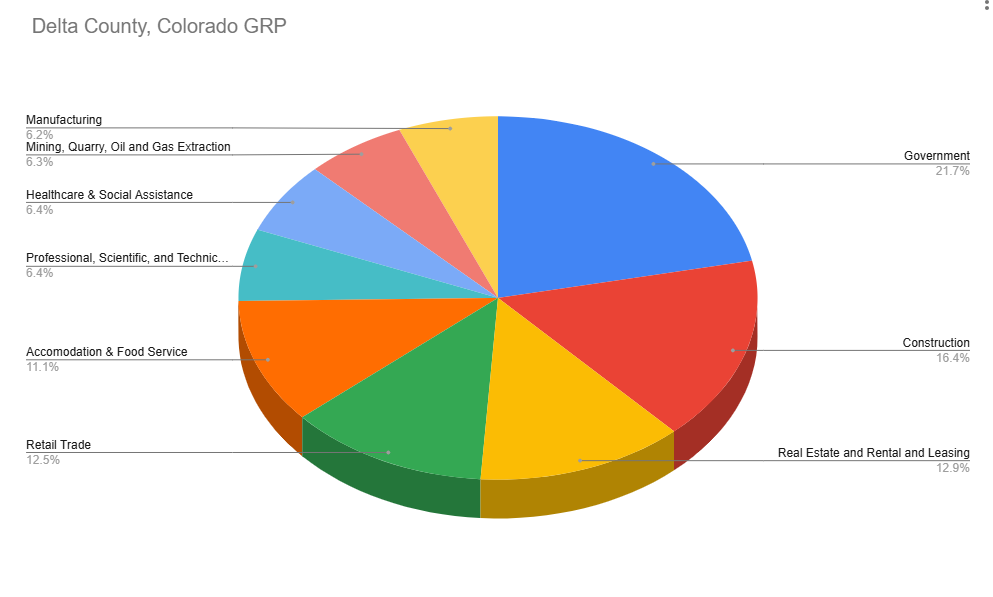
Gross Domestic Product (GRP) is the total value of goods and services produced by a region. In 2022, nominal GDP in Delta County, CO grew by 1.8%. *
Gross Regional Product for Delta County, Colorado- $6.02 Billion with the State of Colorado totaling $524.56 Billion Q4, 2024. **
*Source Delta County Economic Update Q4 2024 ** Lightcast Economy Overview- Colorado Workforce


